 03-10-2006, 04:30 PM
|
#1 (permalink) |
|
Insane
Location: Calgary
|
How to make graphs
I'm an economic student, and most of my assignments (and notes) have tons of graphs in them.
Does anyone know of a good program to use to make them? I need to be able to label axis, points along the line (not numerical, but with characters) label lines, etc. using a something like photoshop and the like is a bit of a pain. Any suggestions?
__________________
The truth is, wherever you choose to be, it's the wrong place. Chuck Palahniuk , Diary |

|
|
03-10-2006, 05:42 PM
|
#3 (permalink) |
|
Location: up north
|
if you're not rich enough for exel(or dont suport m$), then get openoffice. does the same as excel. for free. takes less room on your computer.
 http://www.openoffice.org/index.html
__________________
|
|
|
|
03-11-2006, 11:18 AM
|
#5 (permalink) |
|
Insane
Location: Calgary
|
Ok, I can make plots with data and such in excel, but i need a bit more free form ability..
(able to make a money demand vs money supply curve for example) I haven't figured out how to do free form graphs in excel.. any suggestions for tutorials? more so, stuff like this: http://www.bized.ac.uk/cgi-bin/gloss...browsediag=235
__________________
The truth is, wherever you choose to be, it's the wrong place. Chuck Palahniuk , Diary |
|
|
|
03-11-2006, 12:09 PM
|
#6 (permalink) |
|
Détente
Location: AWOL in Edmonton
|
Further to my unwavering love and devotion of microsoft office, I find the "drawing" toolbar is pretty handy (in word, ppt) for graphs such as what you linked, but in which case they aren't actually a plot of anything, but just a drawing. Nonetheless, I my first response, looking at the graph you linked, would be to quickly enter three series of data points, plotting 2 of them linearly and the third a first order, but it would take a minute of trial and error manipulating the data to achive the appearance I wanted and I wouldn't know the easiet way to add the "Q1" line.
Off the top of my head I don't know the best way to draw curved lines easily in an office application. I was required to gain basic competance in autocad, which I fall back on for anything that is remotely involved. I think I could do a simple line drawing quicker in autocad than I could manipulate excel data as needed. |
|
|
|
03-11-2006, 01:00 PM
|
#7 (permalink) |
|
pigglet pigglet
Location: Locash
|
If you can make up data, you can do it in excel. If not, then I'd be tempted to draw it in powerpoint. I've used other packages, such as CorelDraw
I did the following by making the basic plot in excel, and added some of the lines and the text in powerpoint. Depends on what you want to do. I don't personally like the way excel makes plots, so I usually load my data into MatLab. But that would be a little more difficult than what I think you want to do. 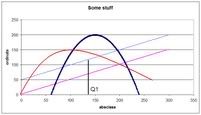 edit. crap, that's tiny. If you can tell if that's sort of what you're looking for, then you've got good eyesight.
__________________
You don't love me, you just love my piggy style Last edited by pig; 03-11-2006 at 01:03 PM.. |
|
|
|
03-11-2006, 03:01 PM
|
#8 (permalink) |
|
Apocalypse Nerd
|
When I was in college I spent some money on a great program called mathcad which simply stated had an excellent graphing program installed. In spite of this -one of my classes insisted that I produce graphs in Excel claiming that it will make me Hirable when I got out of college.
10 years later I make graphs in Excel in almost a weekly basis. I know that there are higher quality programs out there -but for right now -excel is what I've got. Plus it comes installed in most Pentiums... |
|
|
|
03-12-2006, 05:40 AM
|
#11 (permalink) |
|
Junkie
Location: Melbourne, Australia
|
Oh.. I was just reading further.
Do you want to draw the curve then - perhaps as example of something for which you don't have data? If so - you might be able to create some curves in Powerpoint. (No not freehand, I mean explicitely add a curve object). Ditto Visio and even Office using the shapes toolbar. Another way though. You can probably stick values into a plotting program (or Excel) and ask it to fit a curve to the points. Cubic splines are a curve type that comes to mind. These approximate pieces of flexible material pinned to a board/paper (if I recall correctly). Don't use too many points. Three to five should be fine. Failing that - I've seen freehand corrections drawn onto board reports. Haha. From a distance it looks ok. : > |
|
|
|
03-17-2006, 07:59 AM
|
#14 (permalink) |
|
Détente
Location: AWOL in Edmonton
|
The whole point of excel is that it is a dynanmic spreadsheet. Changing data is easy and directly changes the plot as needed. I've never used gnuplot, but I have done my share of matlab. matlab is great for matricies, but is barely satisfactory for graphs.
I spent a couple hours the last two days working on a paper/ field report regarding soil consolidation data, which involved 10 load increments and 8 samples (at least 10 series on 8 plots, plus many more). Excel worked great for all the plots, espeically the semilog plots. I'd hate to have to input and change that amount of data in finicky matlab. |
|
|
|
03-17-2006, 08:50 AM
|
#15 (permalink) | |
|
pigglet pigglet
Location: Locash
|
Quote:
Seriously, I can't stand excel for my "serious" publication grade plots - but it's great for quick data analysis and trend plots. Once I get it all pretty and ready to go, I load 'er into MatLab and make pretty ones. If you write the front end script for MatLab, you can make it as dynamic as you want it to be. I guess the same is true with macros in excel, but I've never been able to get into the macro coding for it. If this is how you play excel, how much of a pain in the ass are the macros? ps. I think metalgeek must have flown the coop. pps. i can't believe i'm discussing flipping excel vs. matlab plot on TFP.
__________________
You don't love me, you just love my piggy style |
|
|
|
|
03-19-2006, 04:52 AM
|
#16 (permalink) | |
|
A Storm Is Coming
Location: The Great White North
|
Quote:
__________________
If you're wringing your hands you can't roll up your shirt sleeves. Stangers have the best candy. |
|
|
|
|
03-21-2006, 11:42 PM
|
#17 (permalink) |
|
Insane
Location: Calgary
|
The problem is the data isn't there for most of my graphs, just generic curves and straight lines.
It's all mainly theory stuff. I'm currently using paint.net (some thing by some microsoft guy or something) works well enough, except I can't get subscripts or superscripts for my text in it.
__________________
The truth is, wherever you choose to be, it's the wrong place. Chuck Palahniuk , Diary |
|
|
|
04-03-2006, 08:51 AM
|
#19 (permalink) | |
|
Fledgling Dead Head
Location: Clarkson U.
|
Quote:
|
|
|
|
|
04-07-2006, 10:38 AM
|
#20 (permalink) | |
|
Rail Baron
Location: Tallyfla
|
Quote:
__________________
"If I am such a genius why am I drunk, lost in the desert, with a bullet in my ass?" -Otto Mannkusser |
|
|
|
|
04-07-2006, 04:26 PM
|
#21 (permalink) | |
|
pigglet pigglet
Location: Locash
|
Quote:
Yeah, what I normally do is copy it into Paint (or a better image app) and save it as an image file. Then load that in with an insert from file. I have nightmares about having to wait for the data to replot every time you flip the slide
__________________
You don't love me, you just love my piggy style |
|
|
|
|
04-09-2006, 03:54 PM
|
#23 (permalink) | |
|
Détente
Location: AWOL in Edmonton
|
Quote:
|
|
|
|
|
04-10-2006, 04:24 PM
|
#24 (permalink) | |
|
Insane
|
Quote:
Code:
data=dlmread('test_data.txt');
col1=data(:,1);
col2=data(:,2);
plot(col1,col2,'o')
% maybe plot a formula to go with that:
t=0:.1:pi;
hold on
plot(t,cos(t))
% and do whatever you want with the labels
set(gca,'xtick',[0,pi,pi/2])
set(gca,'xticklabel','Moose|Apple|Friday')
|
|
|
|
|
04-10-2006, 09:09 PM
|
#25 (permalink) |
|
Junkie
|
When I said changing i meant changing often. Sometimes i'm generating data every couple minutes and I want to regraph it in under a second. I don't want to worry about importing. Ohh yeah and I want to be able to export to eps..... or any vector format that is supported by latex.
Excell is useful for initial stuff but in reality it isn't nearly powerfull enough or quick enough for me. That is why I consider matlab to be much better for graphing. Also matlab graphs look a lot better than excell graphs. I always have to chuckle when i'm at a confrence and I see an excell graph that looks like crap. |
|
|
|
04-10-2006, 09:41 PM
|
#26 (permalink) |
|
Détente
Location: AWOL in Edmonton
|
This thread has been totally jacked. I don't think excel or matlab is what the original poster is looking for.
Last thursday I was running a bunch of soil sample direct shear strength tests. The apparatus, recording 6 variables ran to a windows based pc and directly imported into excel. It did take a few minutes to set up the initial spreadsheet hotcells and formulae, but the resulting graphs were automatic and exactly what I needed. Incidently, this was for school, but I've used a nearly identical system in industry, where I needed to prepare site investigation reports. In both cases was plenty fast, powerful enough, and looked just fine. I have no doubt that matlab works great for many people. I understand why people don't like excel. But it works very well for me. |
|
|
|
04-11-2006, 05:44 AM
|
#27 (permalink) |
|
Crazy
Location: Bath, UK
|
If you are looking for presentation quality graphs then SigmaPlot is very good, it can export as jpeg/eps/png @ 300dpi and you can add text, lines, arrows, etc. It can import and work with excel files and has some good fitting and transform routines. I do all my analysis in excel and copy and paste to sigmaplot. By default it produces graphs that look MUCH nicer than excels.
In my experience its easier to create good graphs in SigmaPlot rather than Excel OR MathCad, which is not a dedicated presentation package. I have not tried gnuplot. Go LaTeX.
__________________
I like to browse in occult bookshops if for no other reason than to refresh my commitment to science. -- Heinz Pagels, "The Dreams of Reason" |
|
|
|
04-11-2006, 06:04 PM
|
#28 (permalink) |
|
Psycho
|
If you want to move lines around in excel just plot some random data and click on a point. Then you can drag that point where you want on the graph and any lines connected will go with it. It even changes the values in the spreadsheet.
Make sure you only select one data point when you try to drag, it won't work if you select the entire series. Last edited by Scorpion23; 04-11-2006 at 06:06 PM.. |
|
|
|
04-23-2006, 12:05 AM
|
#29 (permalink) | |
|
Insane
Location: Calgary
|
Quote:
Most of my graphs right now have no real data on them, they're just theoretical, but in some of my classes in the next few years (econometrics 2 and 3) I'll have a lot more real data to plot. currently it's most time series stuff, which is pretty easy to graph, or fancy supply demand graphs..
__________________
The truth is, wherever you choose to be, it's the wrong place. Chuck Palahniuk , Diary |
|
|
|
|
04-24-2006, 08:11 PM
|
#30 (permalink) |
|
Psycho
Location: Princeton, NJ
|
Since we're getting into Matlab type programs...
I have one letter for you: R. The learning curve is hell, but if you are planning on going far in Econ it is spectacular. And it makes spectacular graphs that let you customize anything. |
|
|
| Tags |
| graphs, make |
|
|


