Quote:
|
Originally Posted by ratbastid
...So, grain of salt, I guess, but that's the first time I'd seen it broken down like that, and I'd be very interested in a comparison of like figures (though probably in another thread).
|
I would be interested in a comparison as well, as I found
This article at the Tax Foundation site, which is listed as one of the sources in the chart above. It has much different numbers as to total taxes paid for Fed/State/Local per quintile. Specifically on page 42:
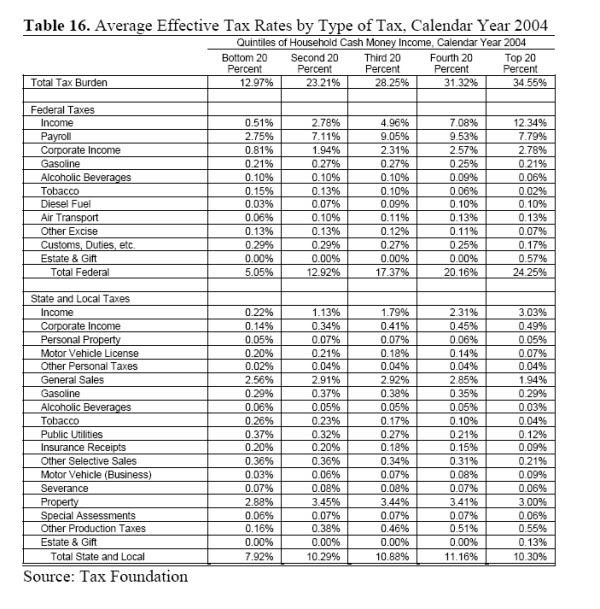
So the question is how these disparate charts came to be, and which is closer to truth? You're right though, it should probably be started in another thread, sorry for the minor threadjack.